Three Project Management Tools You Should Be Using Every Day
Project management gets a bad rap.
Product management
is usually one of those topics, that when I begin to discuss it, people’s eyes begin to roll right back into their heads. When I dare talk about project management tools, I am quickly left standing talking to myself.
There are project management tools, however, that if we were to incorporate them into our daily activities, could dramatically make us more productive and ultimately more successful! I suggest three such project planning tools. the Gantt Chart, Extreme project calendaring, and a Kanban board.
1. The Gantt Chart
First, the Gantt chart was created by—you guessed it—Henry Gantt. He developed it in the early part of the 20th century with some of his compatriots, Frederick Winslow Taylor (the father of Scientific Management), Frank Gilbreth (pioneer of time and motion studies), Henry Ford, and even future Supreme Court Justice Louis Brandeis. They were messing around with tools to help factories become more productive and profitable. Gantt subsequently arranged a marriage between a task list and a timeline. That’s quite simply what a Gantt chart is. It is a document that combines a list of tasks running down the left-hand side of the page and a bar graph to the right of the page representing a time estimate for each one of the tasks in the list.

It’s a fairly straightforward and useful tool.
I love Gantt charts! I really do! Gantt charts are not only plastered all over the walls in my home office showing me my various projects, but Gantt charts, with our home activities, also adorn our refrigerator. I drive my wife crazy!
You see, I love Gantt charts because they give me a clear picture of my tasks, of when I should be working on those tasks, and completing them, of how my tasks interrelate to one another, and of my progress. It is a visual and a graphical tool. That’s important for most of us.
The Gantt chart also, and perhaps more importantly, helps me to think about “process” in the context of my work. Most of us miss the “process” issues!
Process, by the way, is simply a series of steps to complete a task.
When it comes to being more productive and more successful, process is extremely important! Most of the daily work we do is done working on individual tasks without much regard to how they all fit together. We don’t think about all the steps necessary to complete the job. The Gantt chart helps us see the larger picture and then gives us data from which to adjust the plan. Without the larger picture and the progress data, we get blindsided by things that didn’t go according to the plan. The Gantt chart helps train our brains to think about process issues!
Incorporating Gantt charts into our daily (work, family, and personal) activities can have dramatic effects on our success!
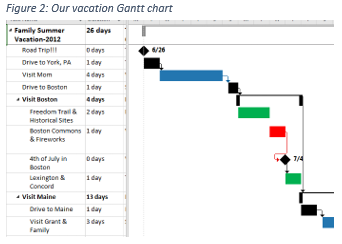
Here’s a quick example. Several summers ago, my family and I piled into our minivan, left the heat of South Carolina, and headed to New England for a much-anticipated vacation. So, being the consummate project manager, I drew up the Gantt chart. (You can probably see my wife’s eyes rolling. Can’t you?)
 My family had two issues with my Gantt chart. The first was that they looked at the Gantt chart as being a rigid tool. They said “Dad, we’re on vacation! Why do we have to do things at certain times?” So, I explained that this was an estimate of our timeline and it was not to be viewed as a fixed schedule. Now, that’s an important issue. Gantt charts are based on estimated timelines, not on a rigid schedule!
The second issue was that my wife and daughter noticed that the schedule was heavy on historical activities. That made sense to me and my son because we are big history buffs. However, my wife and daughter noticed something that, in their minds at least, was glaringly missing from the schedule. Shopping in Boston! Again, the Gantt chart was viewed as too rigid. There was no opportunity to add activities “on the fly.”
We discussed adding shopping to the schedule. The Gantt chart revealed, however, that something in the current schedule needed to give to meet the milestone activity of spending the 4th of July on Boston Commons. The Gantt chart provided us the data in which to make the decision of 1) shortening the Freedom Trail to one day, and 2) adding a “shopping” day to the schedule.
The Gantt chart is a visual tool that aids in the scheduling and in decision-making processes.
2. Extreme Project Calendaring
I have learned that what gets scheduled gets accomplished. If it is not in my calendar, it does not get my time, attention, or energy and it will not be achieved. So, for several years now, I have been practicing “extreme project calendaring.”
Simply, a project calendar is a view of the project tasks within a calendar setting (i.e. daily, weekly, monthly, etc.).
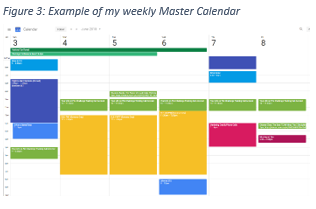
I use Google calendars, but this works in other calendar applications as well. I have created multiple calendars in my Google account. I have 25 calendars as of this writing. I account for categories of activities in separate calendars. For example, my client meetings are on one calendar. My writing times are scheduled in another calendar. My family activities are on another calendar. My air travel is scheduled in yet another calendar. And so on and so on. The calendars are then synched together and viewed in a “master” calendar. I can, of course, toggle each of the calendars on and off in the master calendar to show me what I want to see.
 Extreme calendaring has several benefits. First, it prevents overscheduling. I see everything in my master calendar and know when I have room to schedule additional items. Second, it enhances my view of the big picture. Some weeks I might want to double down on marketing activities and master calendar reveals whether I have the right mix of activities scheduled. Third, it helps with process issues.
3. Kanban
Kanban is a Japanese word that means signboard or billboard. Kanban was developed as a manufacturing tool in the 1940s by Taiichi Ohno , who was the father of the Toyota Production System. It is based on three principles :
-
Visualize the workflow daily. This is like the Gantt chart because of the visual nature of the tasks on a board.
-
Limit the Work in Progress (WIP). Most of us tend to work on too many activities at a time. Kanban teaches us to a) list out and prioritize all the tasks, b) hold most of them in reserve (called a backlog), and c) limit our active tasks.
-
Improve the flow of work. When one task is completed, the next most important task is then brought forward from the backlog. What is brought forward to be worked on is based on priority level not simply on what’s the next item in the schedule. This encourages constant improvement!
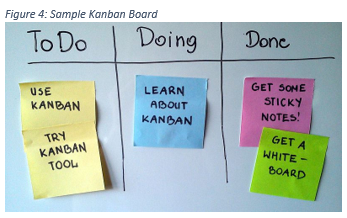
The Kanban board is a visualization tool that encourages optimal workflows. The board can be arranged in many forms, but typically has a “To Do” column, a “Doing” column, and a “Done” column. Simple enough! Tasks are compiled in the To Do column until they are pulled forward to the Doing column, and then pulled into the Done column when completed.
 Kanban boards can be constructed by using pencil and paper, by applying sticky notes to flip charts or whiteboards, or by using some type of software. Trello.com and Microsoft Planner are examples of Kanban boards in software.
Using a Kanban board every day helps me to visualize all my tasks, select only a few tasks to work on, and to adjust my activities as the day unfolds. The “Done” column also gives me cause to celebrate every day!
I have found that, by using these three project management tools in my daily life, I have become more productive, much more successful, and even a happier person. I attribute the successes to being 1) better organized, 2) more in tune with my priorities, 3) more aware of the big picture, and 4) able to adjust my plan when things go off course.
Article sources include:
https://en.wikipedia.org/wiki/Henry_Gantt
https://youtu.be/WzJtA5LK8PQ
https://en.wikipedia.org/wiki/Taiichi_Ohno
Moreira, M. (2013). Being Agile: Your roadmap to successful adoption of Agile (p. 55). New York, NY: Apress.